Over the last year or so I have worked on a number of analytics projects where weather was a required data source. Temperature, humidity, number of sunny days, and precipitation are all used in various way to predict manufacturing processes, equipment failure, energy production/usage and of-course most anything touching agriculture.
I want to share with you a fun way Azure Databricks Notebook Workflows can be used to load weather from NOAA’s Climate Data Online Service while also employing reusable logic with our own custom library. You can’t truly have fun with-out interactive visualization, so let’s also bring in Power BI to make our data pleasantly useful to the masses.
End-2-End Weather Data Engineering
Someone will ask… “Why Azure Databricks? There are many other ways to load weather data.” Of course there are. But Azure Databricks is an immensely scalable platform for Data Engineering (loading and transforming) and Data Science\Analytics. It is probable that you will also want to analyze decades of weather data along with additional related data, such as, market data, production data, consumption data, lunar landings, etc. Databricks is amazing for bringing all types of data together to facilitate exploration and analytics.
While this project uses weather data, the principles we cover, Notebook Workflow, importing custom libraries, model/serve layer in Azure SQL Database and interactive visualizations, are meant to be applicable for any solution you may be working on.
The code is yours.. do with it what you will.
 This project is available on Github.
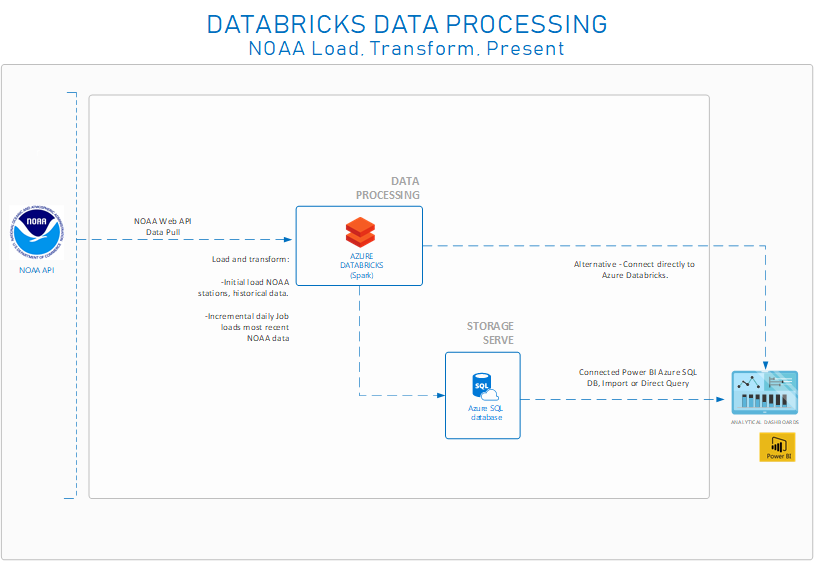
The architecture make this official. Below you will see what the final solution will look like. As mention above, we will employed Azure Databricks for our data processing and Azure SQL Database to serve up the data for data driven insights.
Prerequisites
NOAA API Key
Get your API key NOAA Climate Data Online. The service return a max of 1000 records per call; breaking our ingest into a threaded Databricks Notebook workflow allows us to run multiple calls in parallel; however, the NOAA API does not perform well when running dozens or hundreds of threads so be careful when modifying the thread pool parameter.
Precipitation has an enormous volume of records, so it may not be feasible to use the API to get a number of years of precipitation data for all US States – NOAA does have FTP archives as well and I am modifying the architecture to address loading a merging multiple sources of data (any code changes will be made available on GitHub)
Azure Account
If you don’t already have an Azure account, you can create a free account today.
Azure Databricks
If you have not created an Azure Databricks work space before, please check here to get started.
Running Notebooks with Databricks
Below I have outlined the steps to import the four notebooks and one python wheel file. Import DBC and wheel file, create Azure SQL Database, update values in notebooks, then run notebooks.
Import dbc File
Download the NOAA_Weather.dbc file from GitHub (dbc Files/NOAA_Weather.dbc).
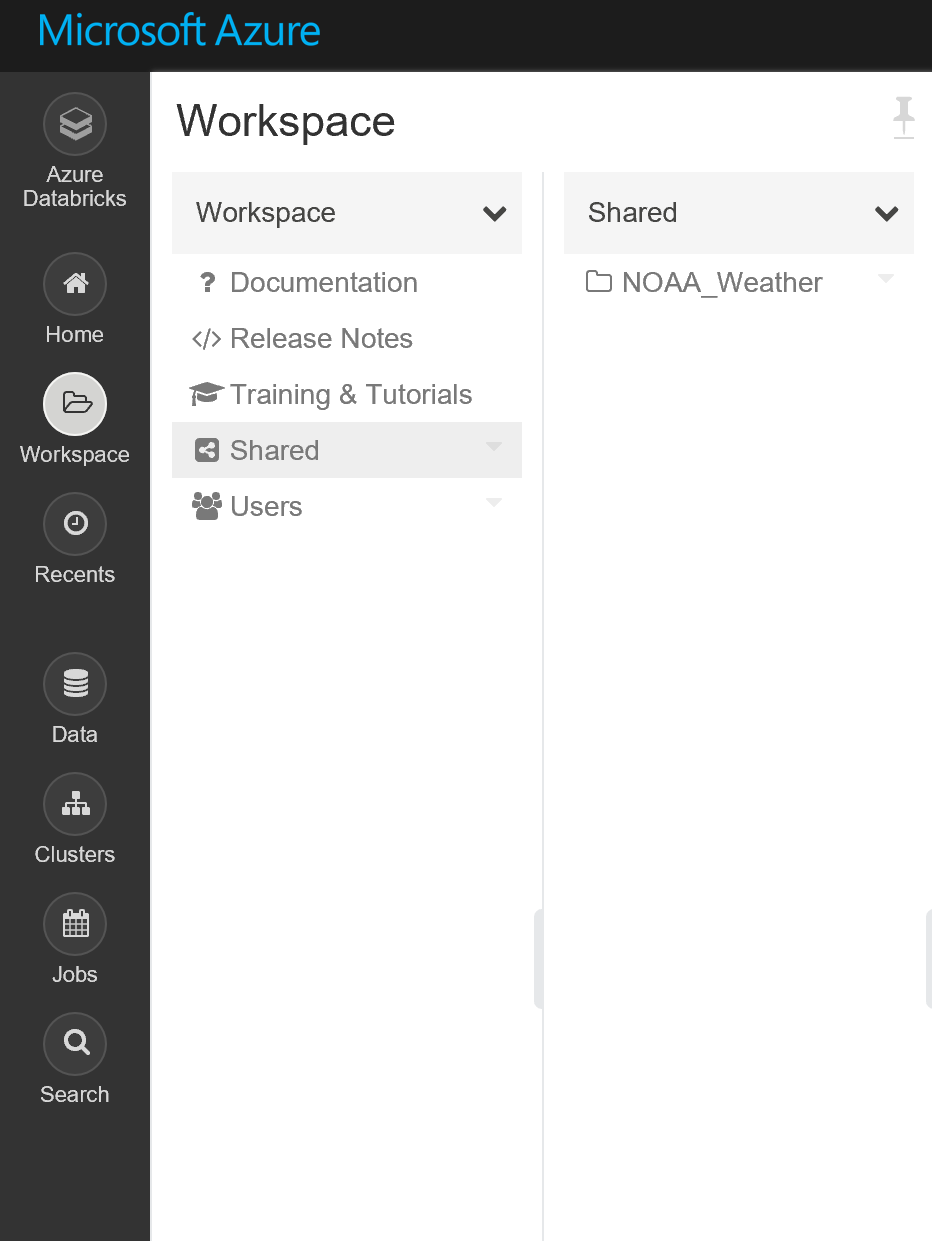
Import the file into the Databricks Shared directory (The Notebooks are looking for the Shared path).
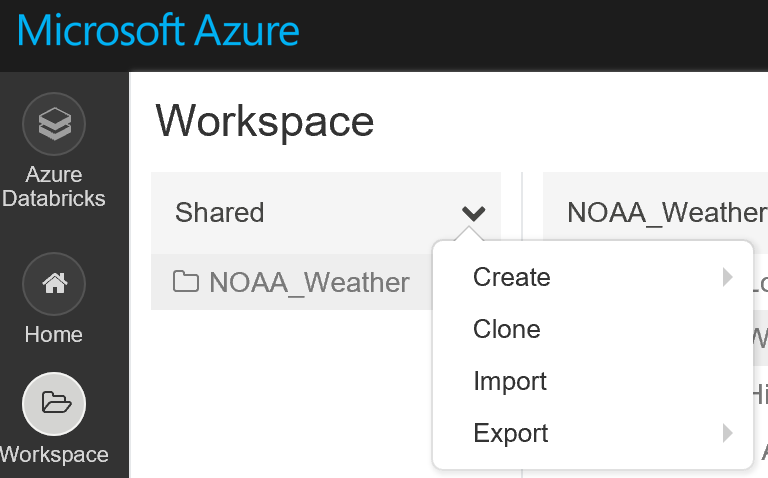
After Importing you should have the Notebook files and the NOAA_Weather folder in your work space.

Import the Wheel File
Maintaining reusable logic (business rule, data rules, etc.) in a whl that can be called from PySpark or as a UDF in SparkSQL will save time in the long-run versus hunting through multiple notebooks/scripts to change code to accommodate changing requirements.
Download the latest AzureDatabricksNoaaLib whl file from GitHub.
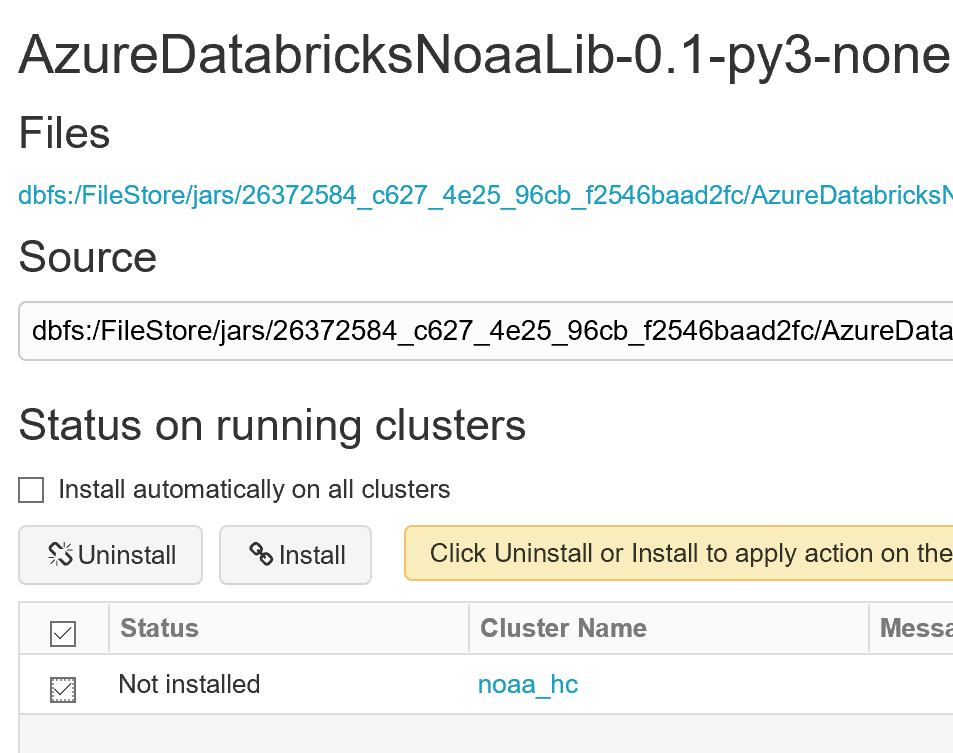
Add the file as a new library to your Azure Databricks cluster (do not attach to all clusters).
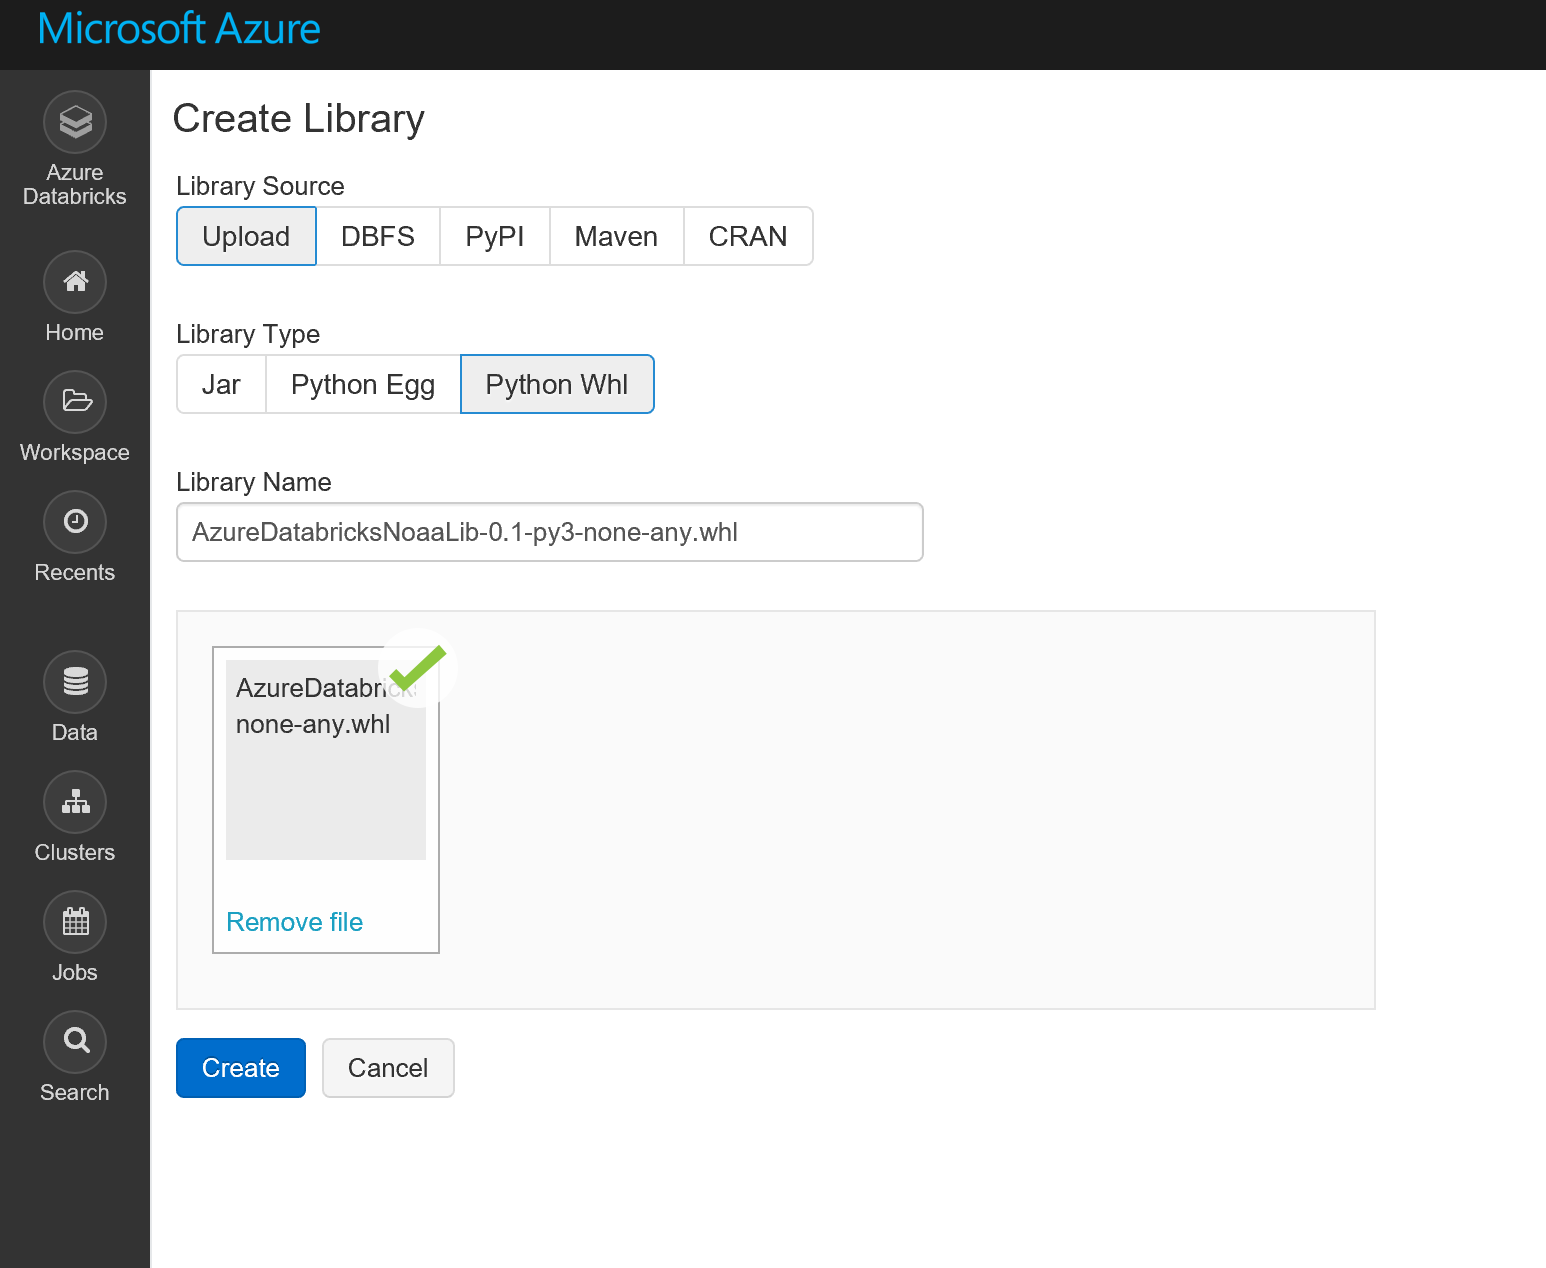
Only install on your running cluster!!
The library has the following methods:
retrieve_all_us_states(api_key) – Returns the FIPS ID for all US States
retrieve_data_sets(api_key) – Returns all data sets ‘GHCND’ is the daily summary
retrieve_data_categories(api_key) – Returns data type data categories, such as, TEMP, LAND, WATER, etc.
retrieve_data_types_by_categoryid(api_key, datacategoryid= ‘TEMP’) – Returns the data types for the data category, average temperature, max temperature, snowfall, etc.
retrieve_weather(api_key,start,stop,fips,datasetid=’GHCND’,datatype=’TAVG’ ) – Returns data for data range, location (fips), data set, and data type.
The code is available on GitHub. A new whl file can be generated by running the following from the directory with the setup.py file.
python setup.py bdist_wheelWrite to Azure SQL DB
To simplify BI developments and optimize cloud compute, we can store our transformed reporting and analytics data assets in Azure SQL Data Warehouse or Azure SQL Database. Considering this is a simple example,we will opt for the latter, Azure SQL Database.
You can follow these steps to set-up your basic Azure SQL Database to house your weather data. You do not; however, need to load from a sample database as we will be populating from Databricks; you can check-out Connection to Azure SQL DB using JDBC for addition details on the code used to write to Azure SQL Database from Databricks.
Running the Notebooks
There are four Azure Databricks Notebooks to create the tables, load historic data, load increment data and write data to a model/server data source. Not all of the notebooks need to be ran manually.
Manually Run
01 – NOAA Load Stations – Creates Station Tables and Loads all US stations using pySpark only solution
Change the API key in the Notebook then run this Notebook first to load dependent data.
It is recommended to use Secrets instead of storing credentials or tokens in a Notebook.
02 – NOAA WorkFlow – Creates staging table and NOAA data table for historical load. Starts threaded workflow calls to 03 – NOAA Historic Load for each month in specified date range.
Change the SQL Credentials and the API key then run this Notebook second to start the workflow.
Do not run
03 – NOAA Historic Load (Ran By 02) – Uses the wheel we installed to retrieve on concurrent thread for multiple parameter combinations.
Do not need to run 03 – NOAA Historic Load manually!!
Schedule to run
04 – NOAA Incremental Job – Schedule this Databricks Notebook to run no more than daily to retrieve the latest weather date available through NOAA’s API.
Please change the API key on this Notebook as well.
Notebooks to update reminder
The NOAA API key needs to be added to:
- 01 – NOAA Load Stations
- 02 – NOAA WorkFlow
- 04 – NOAA Incremental Job
api_key = 'Add NOAA CDO Key'SQL Credentials need to be added to:
- 02 – NOAA WorkFlow
- 04 – NOAA Incremental Job
jdbcUsername = "SQL User Name" ##SQL USER
jdbcPassword = "SQL Password" ##SQL USER Password
jdbcHostname = "[Azure SQL DB Server].database.windows.net" ##Azure SQL DB #####.database.windows.ney
jdbcPort = 1433
jdbcDatabase ="Azure SQL Database" ##Azure SQL DB Name
Visualization with Power BI
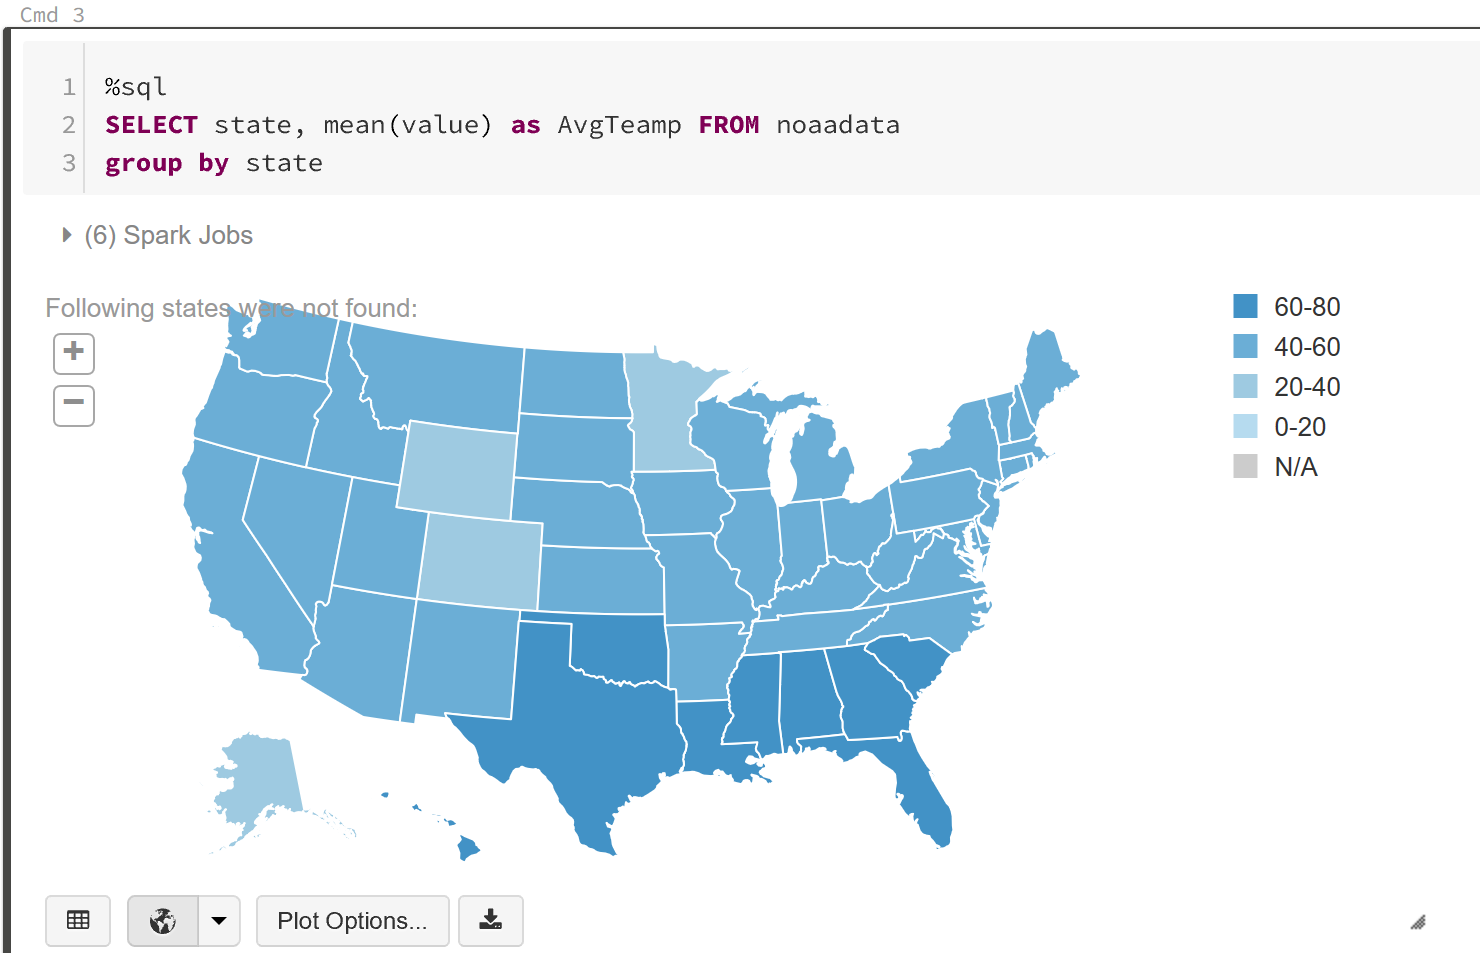
While you can do some cool visualization and dashboards in Azure Databricks, they are not as interactive as you or your users may like or require. It is also very convenient to have a tool that data consumers can quickly jump into and start generating insights, reports and dashboards without having to write code.
This is where Microsoft Power BI comes in; it is aimed at enabling interactive visualizations and data driven insights. It is a simple yet effective tool – does not require years of formal training, any skill level user can create impactful reports quickly.
Connecting Power BI to your Data
Once you have your data loaded into Azure SQL Database, you can stop your Azure Databricks cluster – we do not need to keep it running for report development.
Connecting Power BI is just as easy as connecting to an on premise SQL Database.
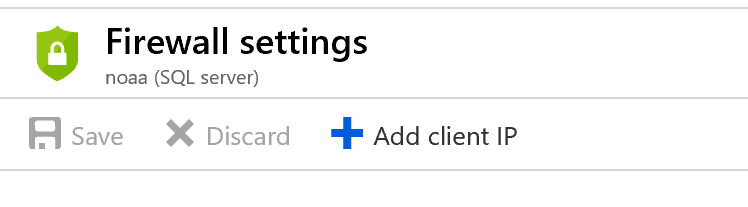
Before connecting Power BI Desktop from you computer to Azure SQL Database please add you client IP to the Azure SQL Db firewall.
Select your Azure SQL DB resource using the Azure Portal, then towards the top select ‘Set server firewall’.
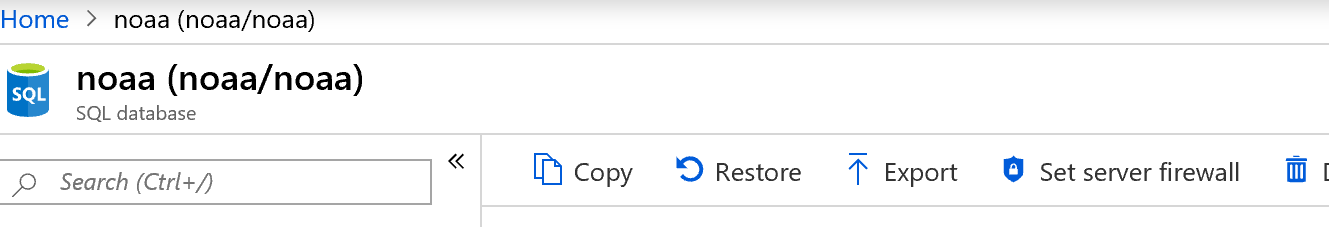
Then add your client IP and click Save.
Get Azure SQL DB Data
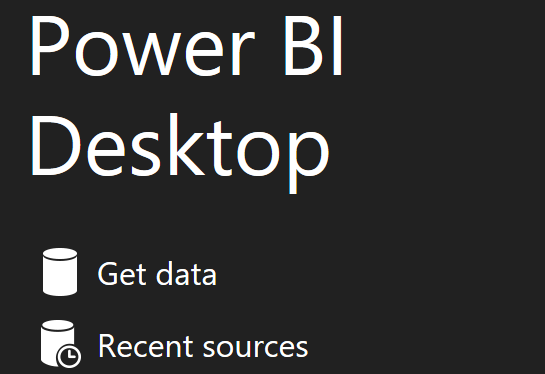
Download Power BI Desktop. When you launch Power BI Desktop you will see a Get Data link – click it.
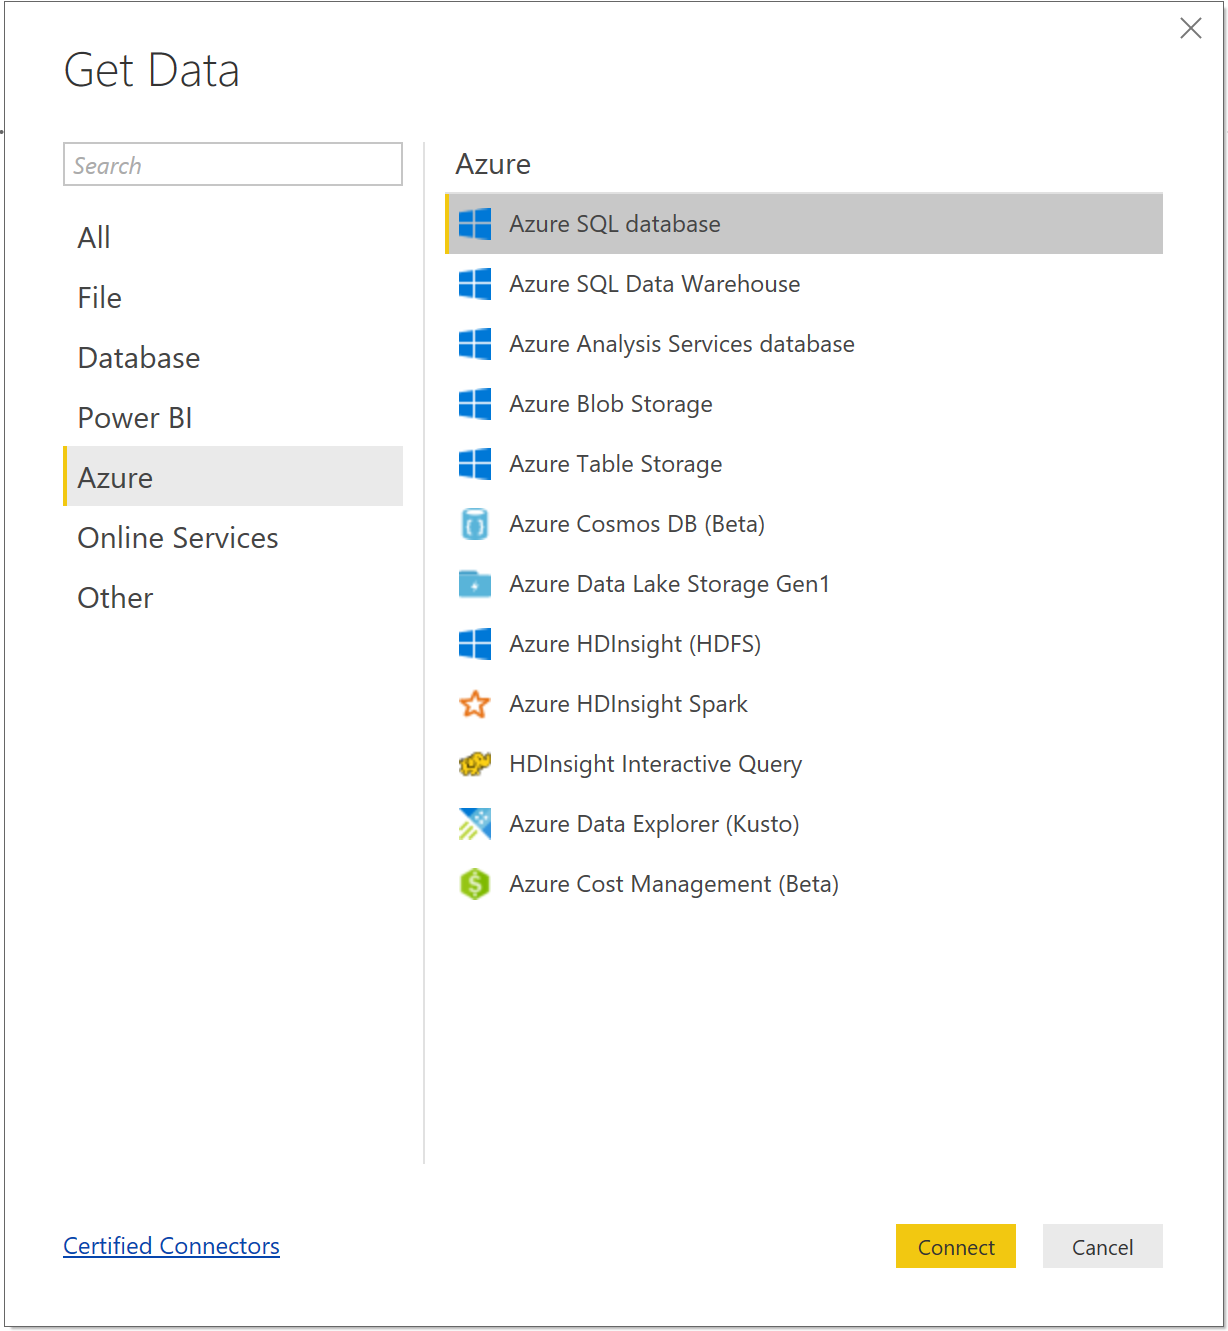
Then select Azure and Azure SQL Database.
Enter the server and database
- [servername].database.windows.net
- [databasename]
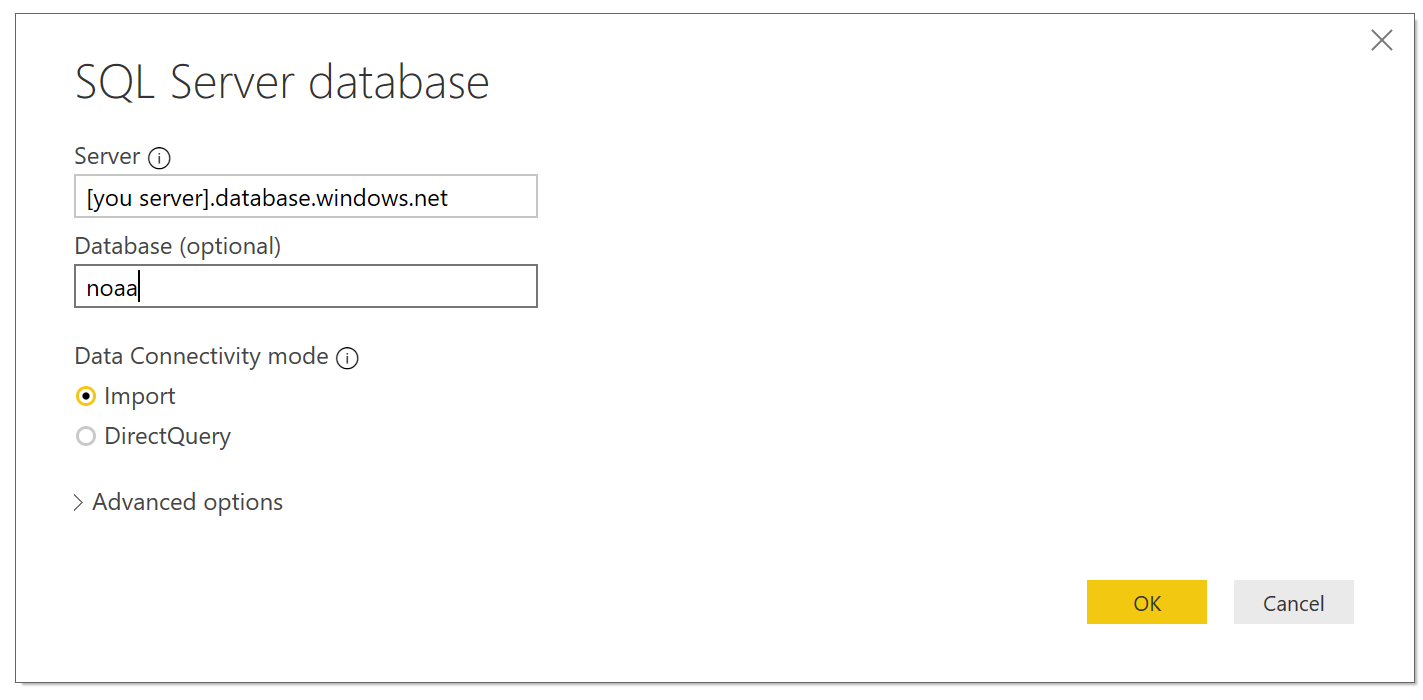
** Use SQL Authentication – pass in the SQL Username and SQL Password you created for the database.
Once you have accessed your database, you should see the NoaaData table we create, select it then Load it.
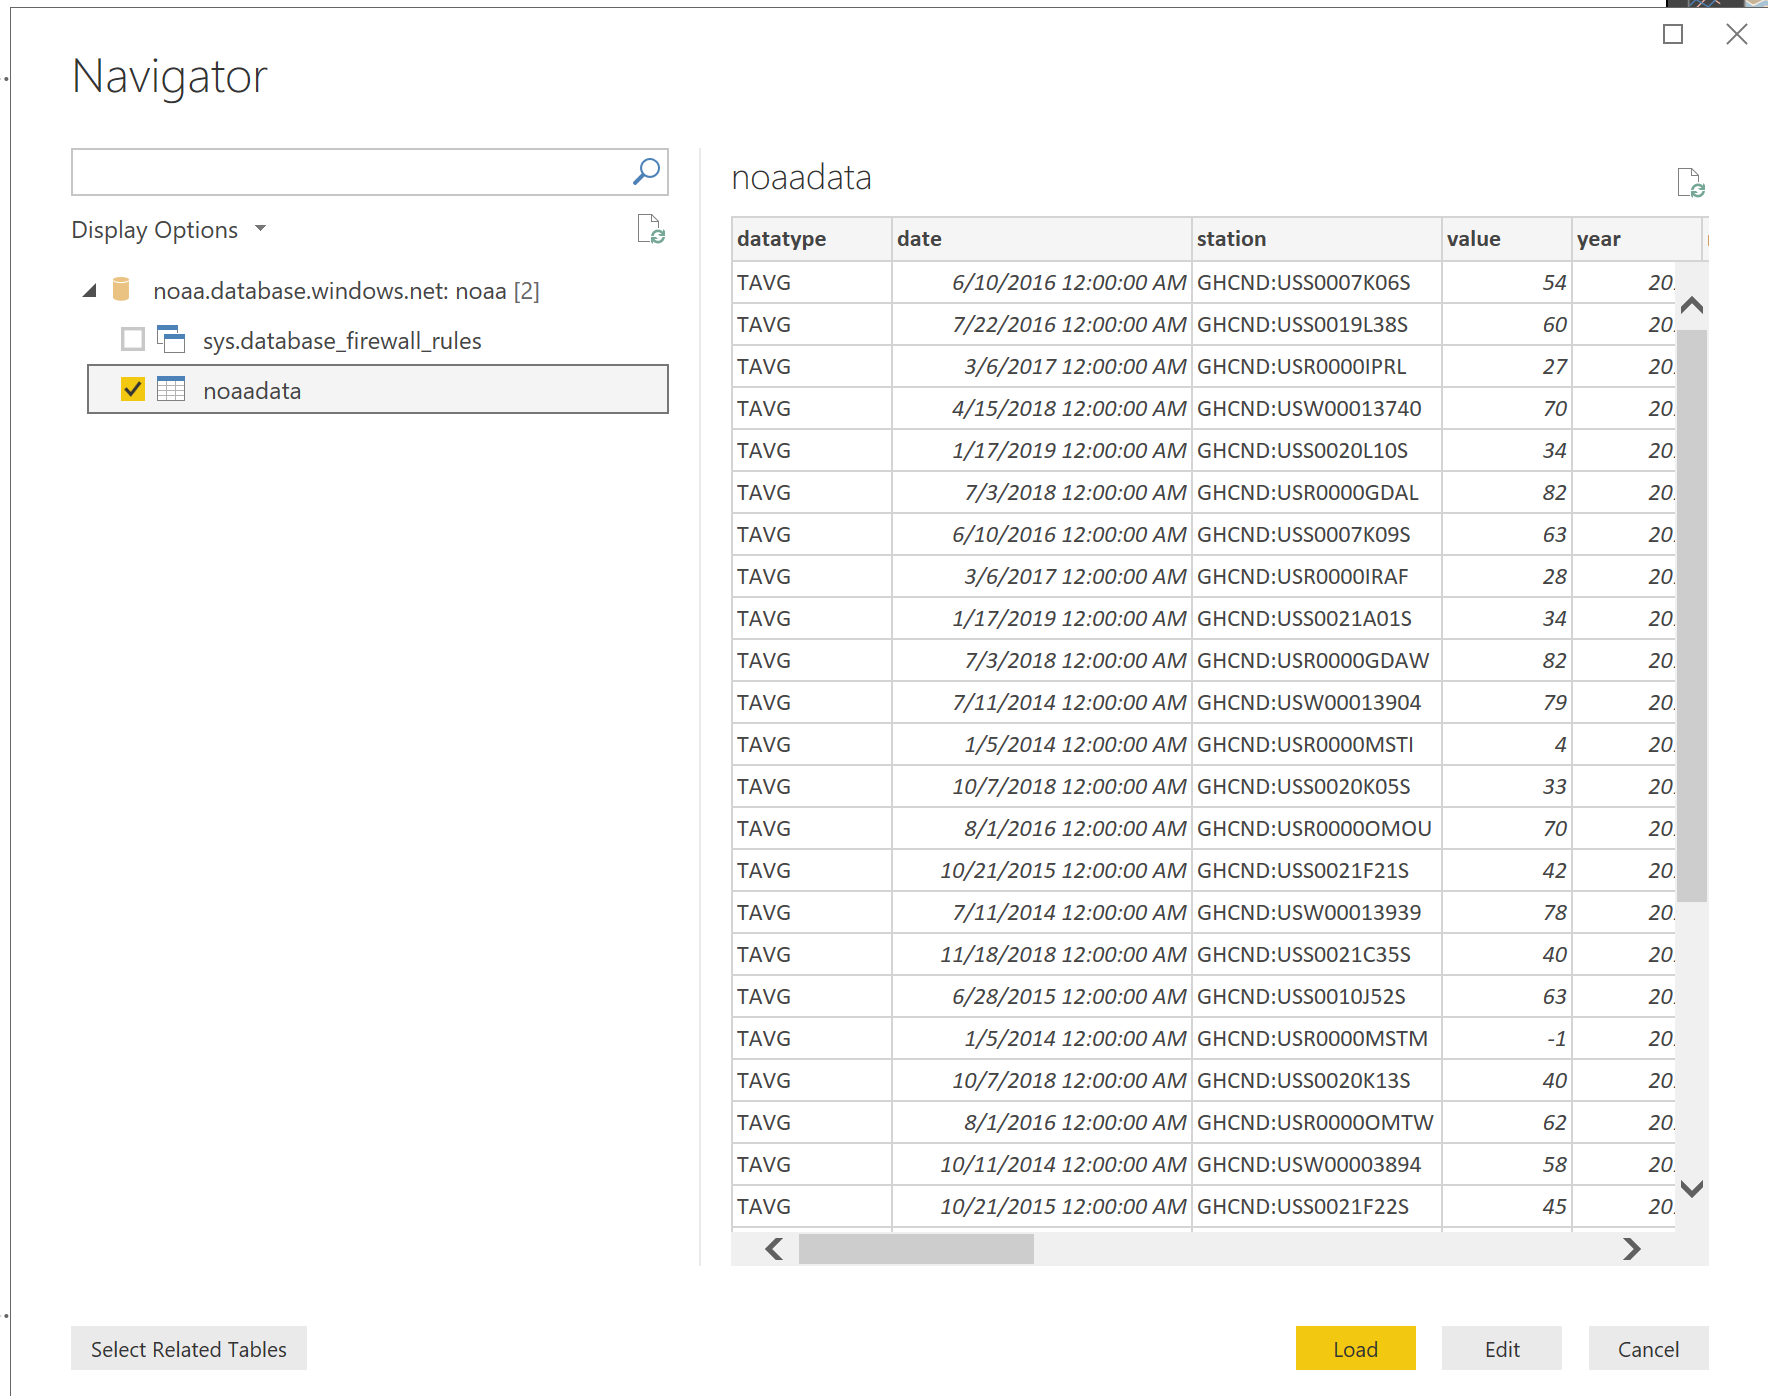
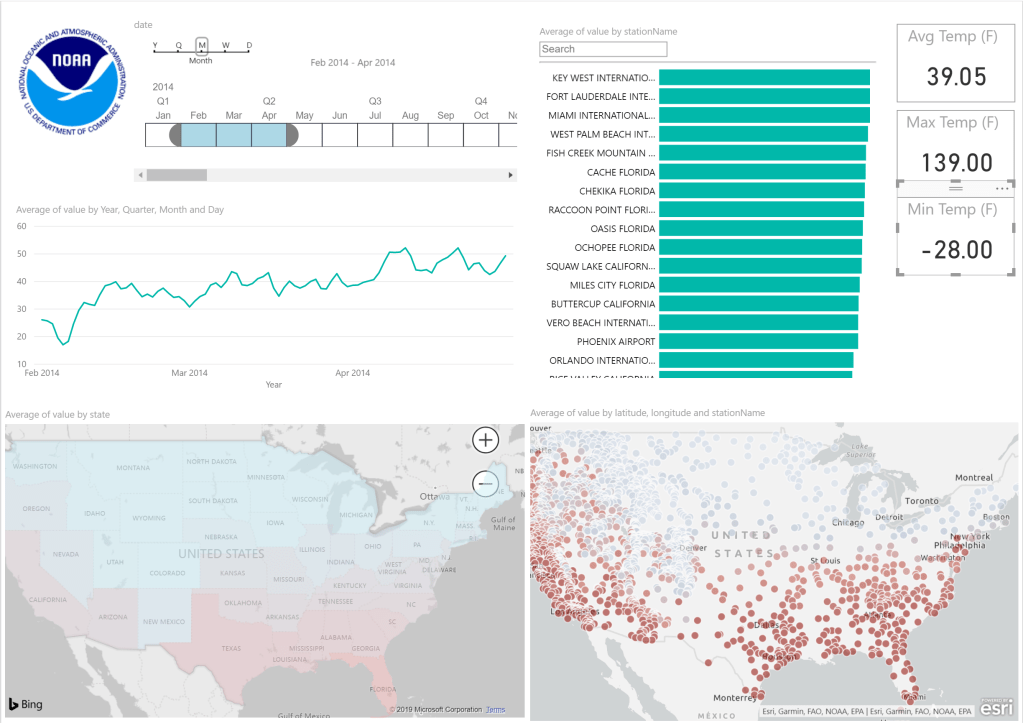
Now you are ready to start developing your own weather Power BI report!! Be creative and have fun.
Here are a few links to get you stared with Power BI:
Getting Started with Power BI Desktop
I hope the data loading and report development went well. Please consider endorsing and sharing your thoughts.
Thanks,
Jonathan

Leave a Reply